AWS provides extensive logging and monitoring capabilities to help ensure the integrity and security of workloads. AWS services like CloudWatch, CloudTrail, VPCFlow and AWS Config provide deep insights into the operational aspects of the system. The logs create a data avalanche that most organizations tend to ignore. This can be a costly mistake that may cause service interruptions, missed opportunities for detecting security breaches or inefficient resource utilization. However, for logging to be effective, it is essential to sort through the logs and to spot any outliers automatically, saving your IT team time and better protecting your workloads.
Tools such as Splunk or Elasticsearch provide the ability to process and analyze logs at scale and provide rich dashboards for detecting and acting on patterns. The process of viewing and analyzing logs got event easier with AWS’s recent launch of Elasticsearch as a service.
Once the service is created and configured, it is critical to setup and monitor critical parameters that indicate potential issues in the environment. Some common metrics are described below.
- Unusual levels of packets rejected from a specific source
- Unusual high levels of TCP/UDP connections on a specific destination or from a specific source.
- Unusual concentrations of activity on a specific resource
- Unusual protocol and port combinations.
- Unusual login attempts from an unknown source.
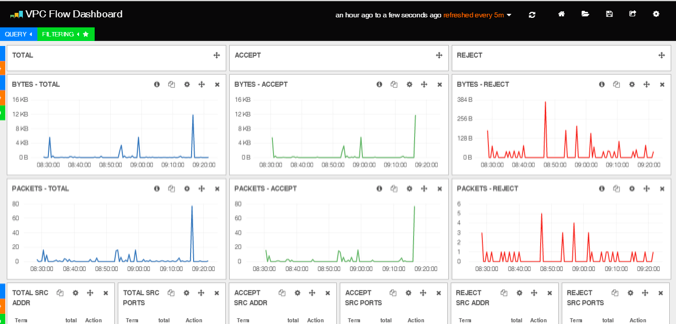
The screenshot below provides a view of a dashboard of network flows through the VPC using the VPC Flow logging service.
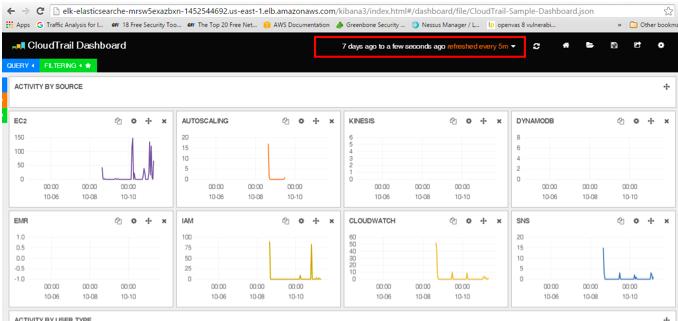
The screenshot below provides a view of CloudTrail metrics displayed in a dashboard related to performance of various AWS services.
Monitoring logs is no longer a nice to have – it’s a need to have to stay on top of your business and ensure the security & integrity of the service. Please send us an email at [email protected] to see how you can reduce the risk of security breaches and avoid buying costly third-party software using the rich set of services AWS provides.


