
Sitecore is a popular digital marketing platform used by marketing organizations in a variety of industry sectors including healthcare, education and public sector amongst others. stackArmor’s engineers have been hosting Sitecore on AWS since 2013 given the strong support for Windows, SQLServer and related Microsoft technologies on the AWS cloud. Running a Sitecore platform at scale requires a strong understanding of systems engineering and management principles as well as being able to leverage the powerful suite of monitoring and management services on AWS.
How we identified Sitecore availability issues?
A large healthcare customer having a highly available and mission critical installation of Sitecore was experiencing server unavailability issue. Upon analysis by the stackArmor Platform Engineering and Operations team it was observed that:
- The unavailability of the site was sporadic – unavailable for few minutes at a time; typically this pattern would repeat itself twice a week during business hours
- AWS CloudWatch was showing High CPU usage on both Sitecore Content Distribution (CD) servers in separate Availability Zones (AZ’s)
- AWS ALB was reporting Gateway Timeout Errors
We analyzed all the logs and metrics to identify the root cause. Log analysis was complicated without any errors immediately visible. We noticed however the repeated log items that said “HttpModule is being initialized”.
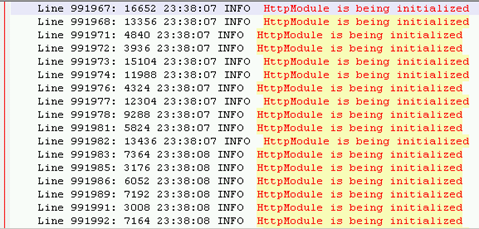
The “HttpModule is being initialized” is reported each time when a new Http module is created. There is a pool of Http modules when the web application starts. When all modules from the pool are busy by handling current requests, new one is created and it is reported in the log.
A lot of such entries sequentially reported in the log indicates heavy load on the solution. Sitecore does not create requests on its own, hence it was assumed that such requests were being originated externally. Upon further drill-down analysis, a review of the AWS Application Load Balancer (ALB) logs revealed the source of these requests. The logs indicated that Nexgate Ruby Client (crawler agent) is making over 2000 Requests a minute causing both Sitecore Content Delivery servers to get loaded causing CPU utilization to spike to 100% thereby unable to handle new requests.
Root Cause Analysis
The Amazon Web Services (AWS) environment for hosting Sitecore was sized to handle more than 2,000 requests per minute. Clearly, there were underlying optimization issues within the system that needed to be addressed. A root cause analysis revealed an interesting set of findings that were leading to performance and availability issues. The fishbone diagram below clearly demonstrated the causes leading to gateway timeout errors being experienced in the logs.
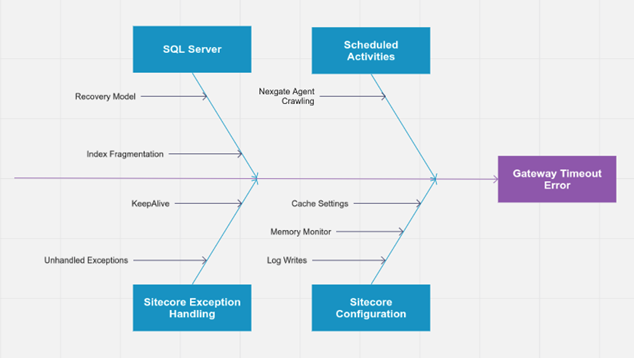
Upon the review and analysis of the various system components, parameters and settings, a comprehensive optimization plan was recommended for implementation. Key findings included:
- SiteCore Configuration
Cache Settings and Memory Monitors were not optimized for 64-bit Operating System, most of the settings were set to default.
- Microsoft SQL Server Indexes
Indexes on various Sitecore Database were fragmented. Index housekeeping was not working properly
SQL Database recovery model was setup to FULL RECOVERY. Full Recovery increases log writes and decreases performance.
- SiteCore Exception Handling
Unhandled Exceptions were generated frequently, that cause a system overhead and should be handled within the application.
- Scheduled Activities
In order to avoid adversely impacting the site during regular business hours, the Nexgate Agent Crawler should be scheduled for off-peak hours.
Platform Engineering and Operations Best Practices
The Amazon Web Services (AWS) environment provides a number of in-built services for logging and monitoring critical services. AWS CloudWatch, CloudWatch Logs and centralized logging allow for efficient analysis and troubleshooting. stackArmor has developed a strong systems operations solution called stackArmor ThreatAlertTM. stackArmor ThreatAlertTM offers the ability to track and monitor key services and systems operations parameters along with integrated log analysis and correlation capabilities using industry standard technologies like Splunk. Forwarding systems logs from various services into a centralized cybersecurity and operations data lake is critical for ensuring robust system operations.